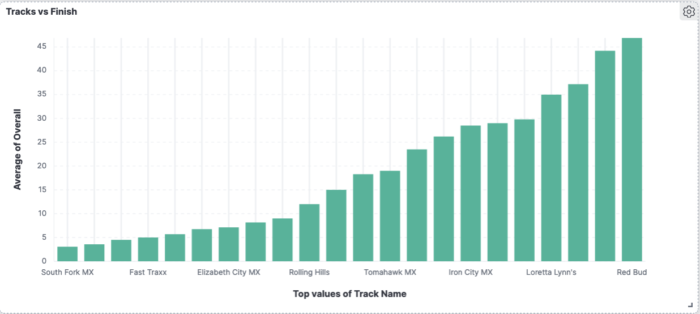
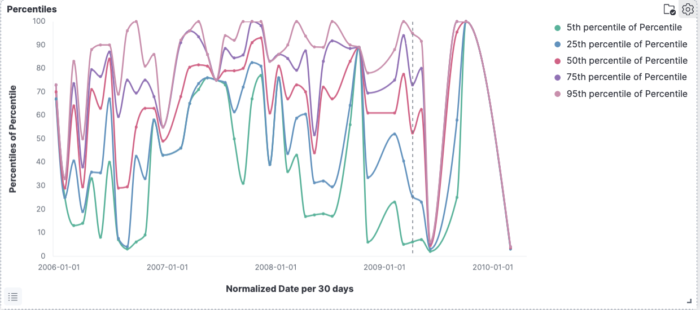
I’ve been wanting to make this blog post for a long time, and today it’s finally here. A data analysis and look back on my motocross career from 2006-2010.
But why 2006? Well, it’s slightly complicated but the short version is apparently the AMA doesn’t keep stats further back than that. Maybe they’re on paper records? Who knows. Regardless, anyone who has ever competed in an AMA sanctioned race since then has their results uploaded to this website (link). While my career spanned a bit before 2006, I actually couldn’t track down my race results from 2005, so that’s just going to have to live forever in my memories.
So what are we going to learn today? Well, this post utilizes a couple tools that I am very familiar with thanks to my career – Elasticsearch and Kibana – both part of the Elastic suite of tools. These tools allow you to ingest data, analyze it, and interact with it in ways you couldn’t have before. In fact, this has been so successful at my current organization that we run entire products based off of the Elasticsearch product suite. I’m going to detail the process I used and steps I took to transform the data from the AMA website into something Elasticsearch can understand, and then we’ll look through some stats!
Races typically look like this on the AMA’s website:
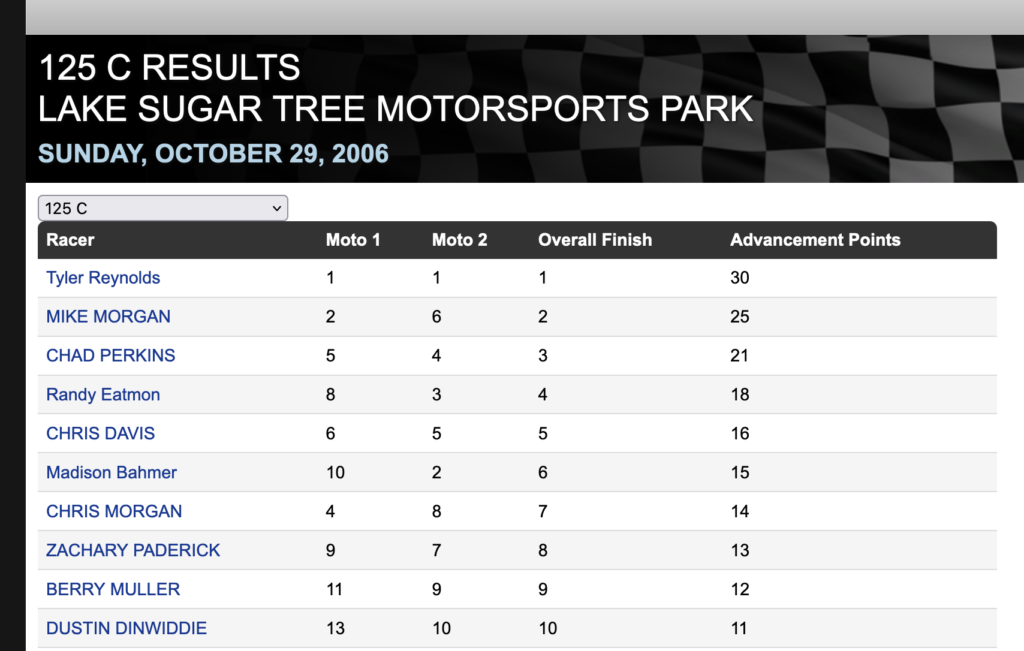
Any individual race is a giant table, with the Racer’s name, moto scores, overall, and class advancement points. You can look up anyone’s stats, which can lead you down some fun rabbit holes with old riders you used to race against, current and former pros, etc.
I took this data and hand copied my row for “Madison Bahmer” into a Google Sheet. Yes, each and every class and race I ever was in. The sheet began to expand with the class name, location, date, total riders, and many other columns beginning to grow my inside of my makeshift database. Fortunately or unfortunately, the number of races I competed in was not to bad, and I ran through every single class from every single race by hand. Surely in the future one could do this with an automated web scraping technology (this is one I used to maintain), but perhaps in the future if I need to do this again we could automate it.
Anyways, now that I had my data inside of my spreadsheet, I started to parse through it. I tried to think of all of the various ways I could slice and dice the data, so I added even more fields:
- State
- Latitude/Longitude
- Normalized Class name (to standards I was familiar with)
- Distance Traveled to get to the track
- Normalized Competitor Level
- Bike Displacement
- Total number of racers in the race
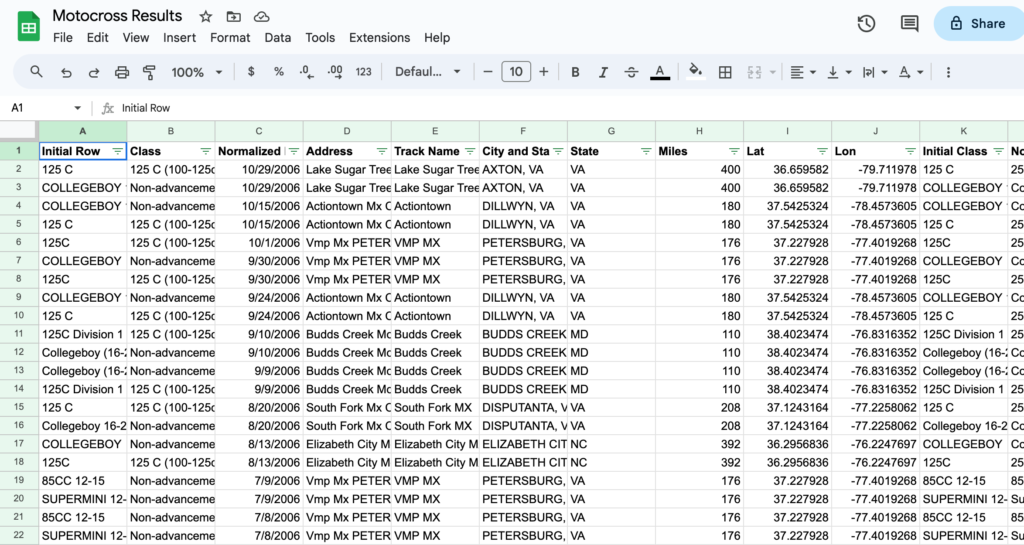
It turned out to be a lot, and I’m sure there is more if I thought about it. Thanks to this planning, we should get some really nice visualizations emerging from the data. I also had to clean up the data, figure out what to do with erroneous entries in AMA’s website (like missing moto scores, or stuff that was flat out incorrect).
The next step was to export this data to a CSV file, which is just a very basic table inside of a text document. Kibana’s data visualizer suite can help us make sense of this CSV by uploading it into my personal Elastic Cloud cluster.
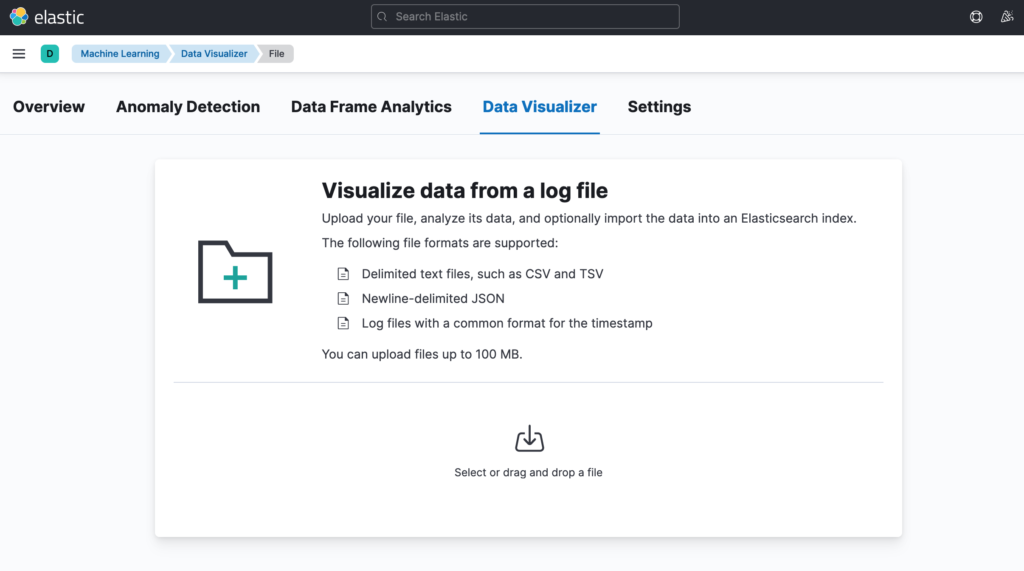
I was able to drag the file in without a hitch, and with some final data massaging of date formats, text types, and general Elasticsearch configuration, I was able to get the data into Elasticsearch! The default view once you make a new data entry looks like a timeline, shown below.
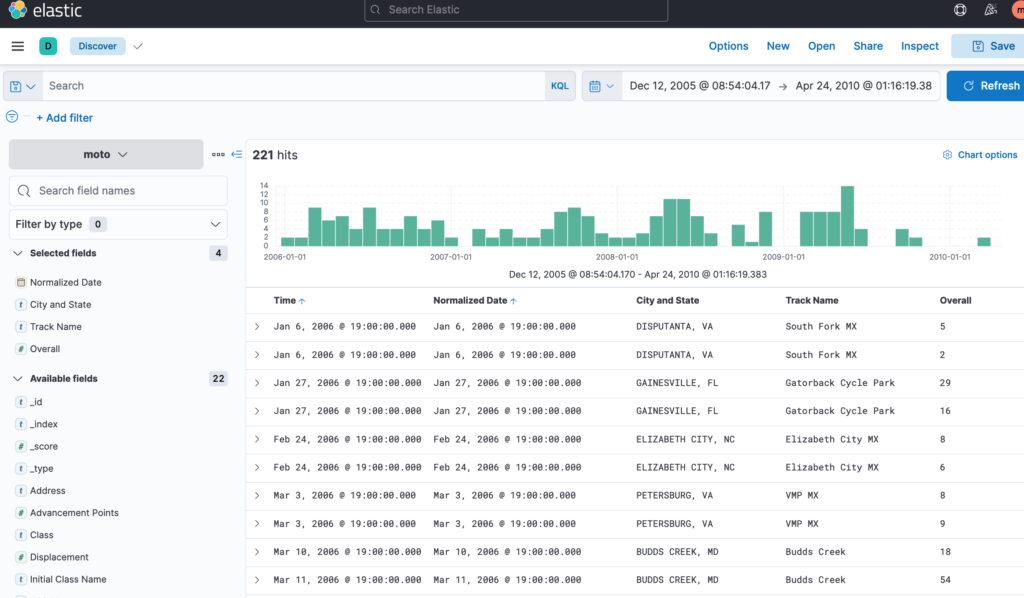
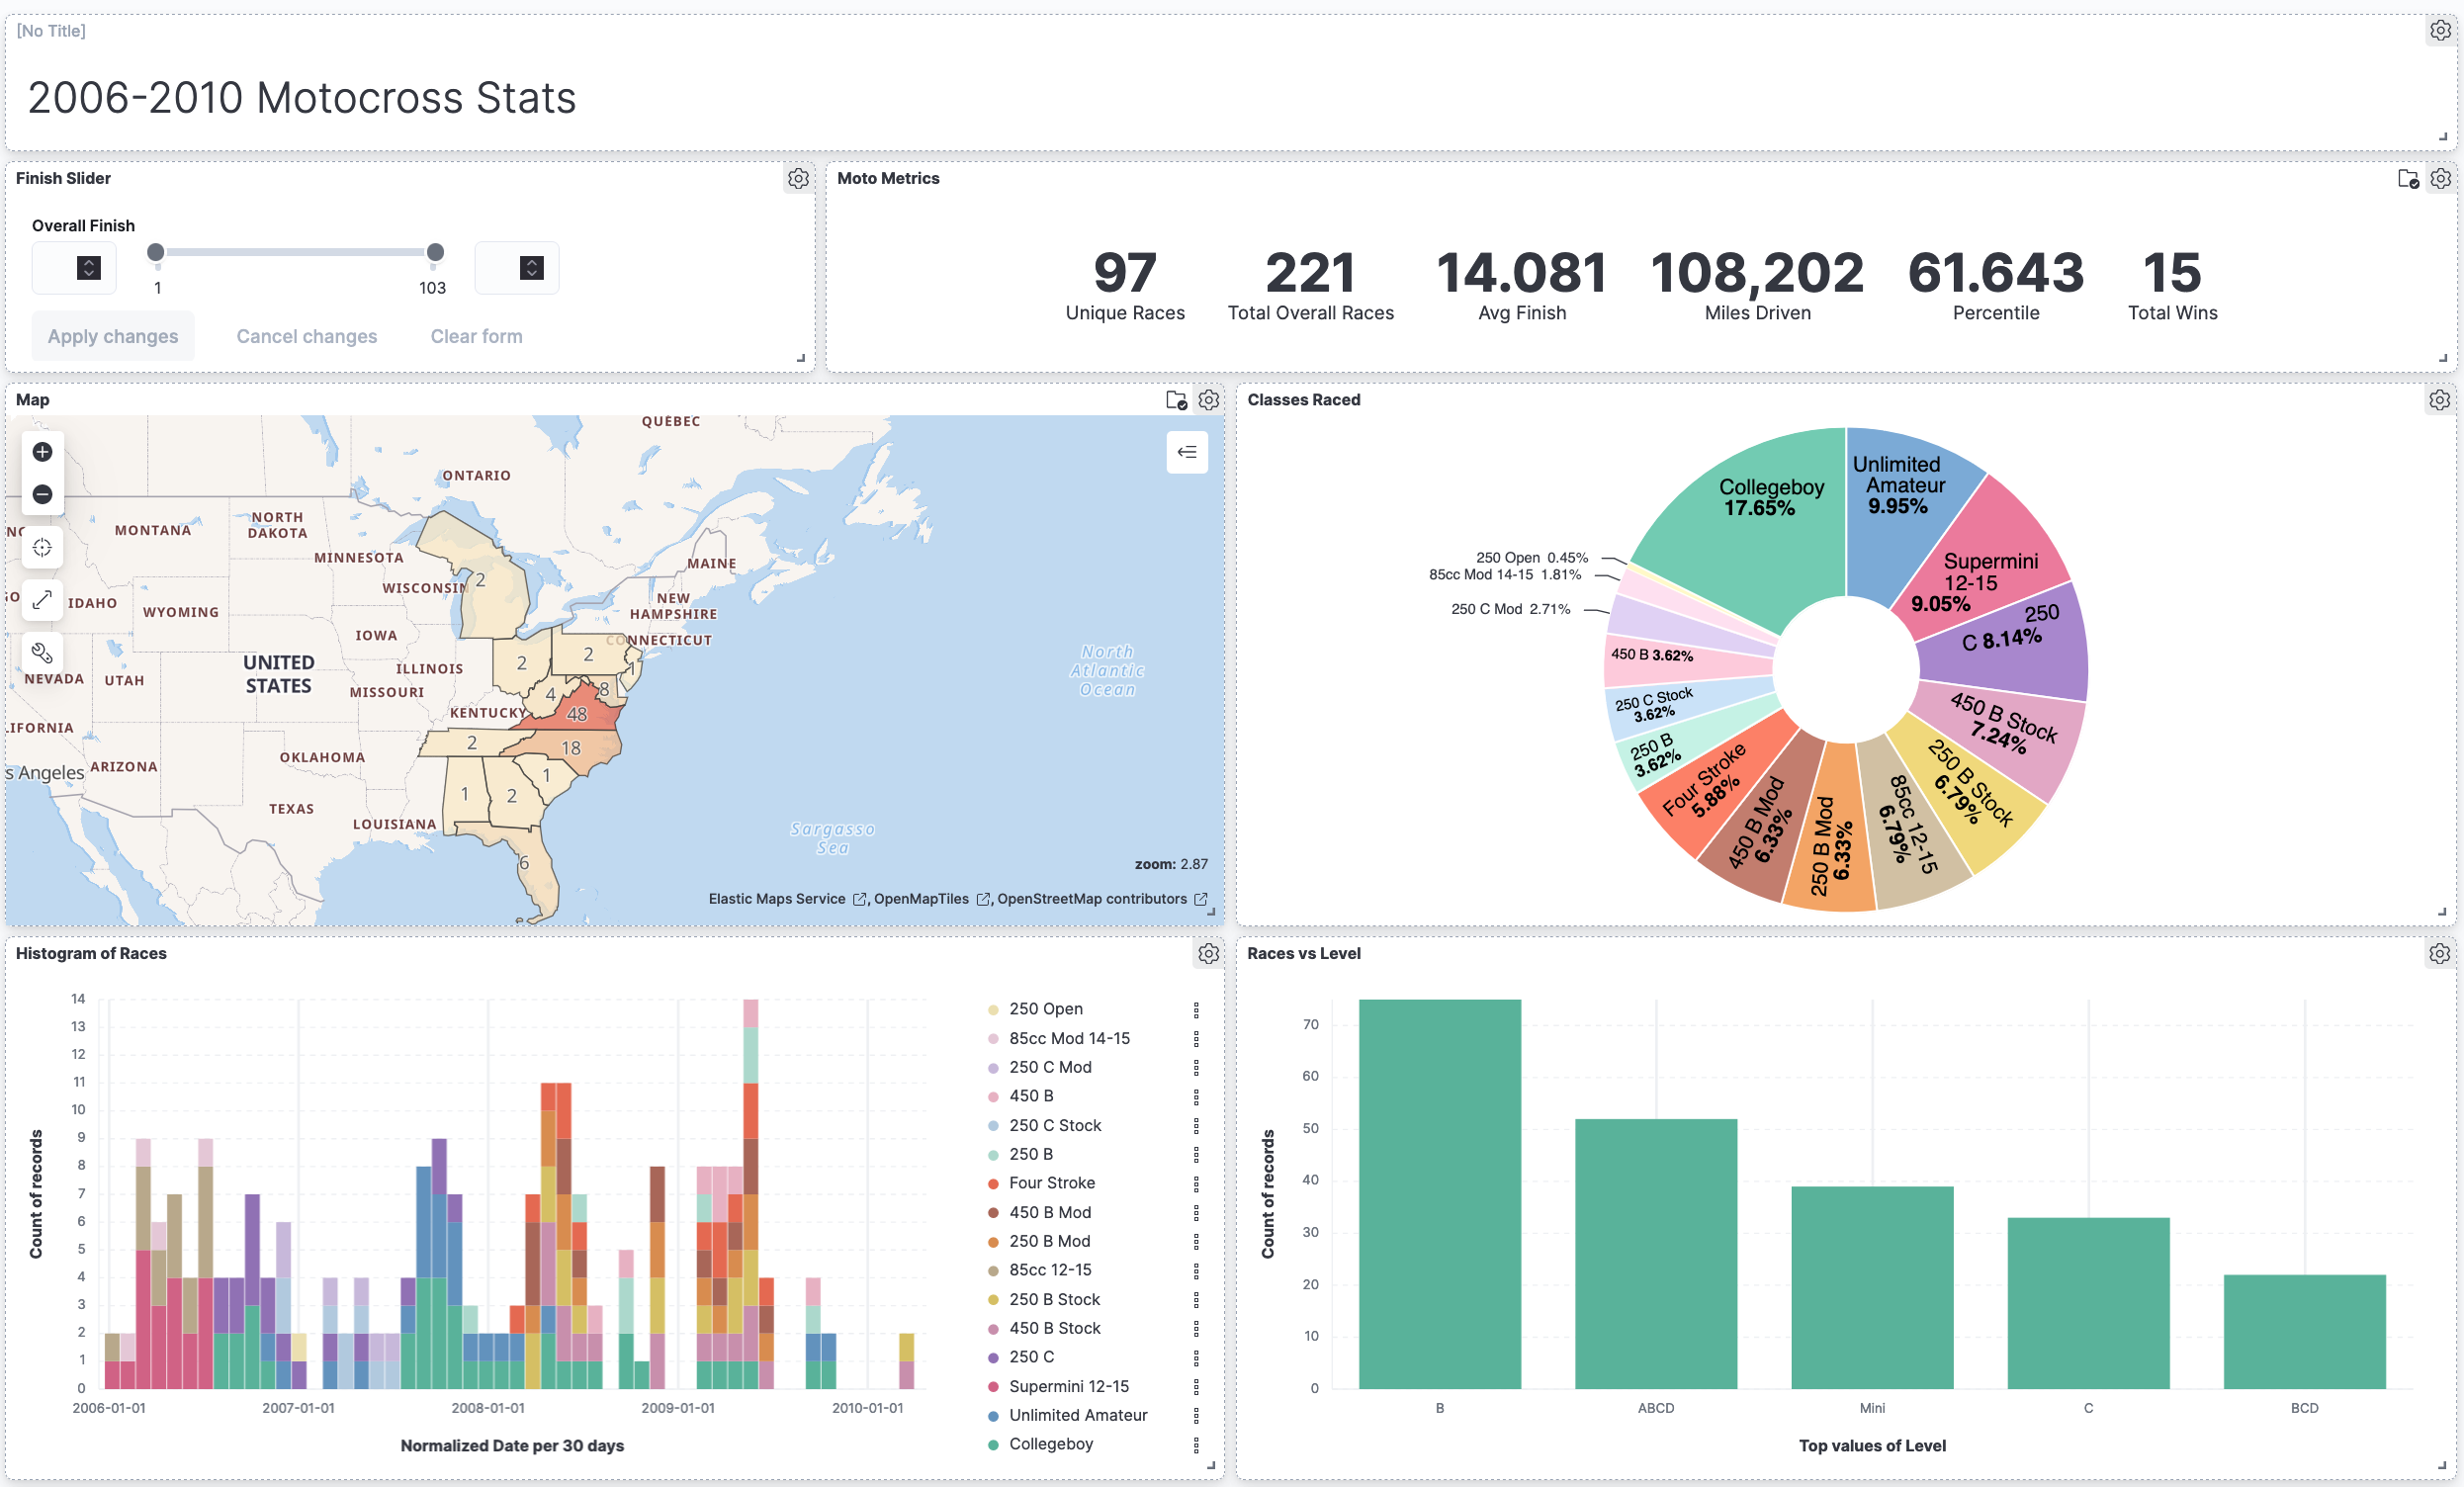
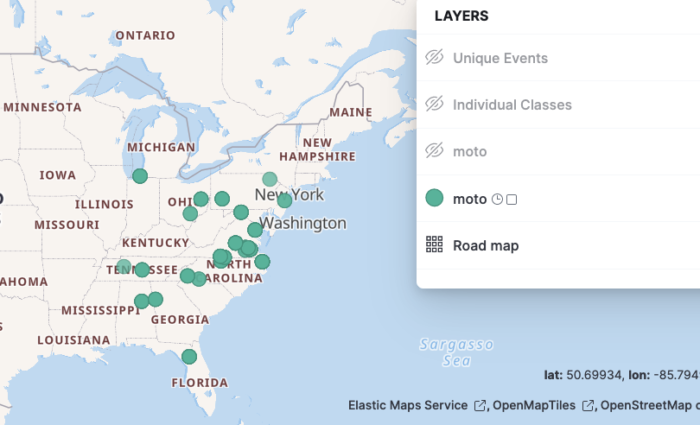
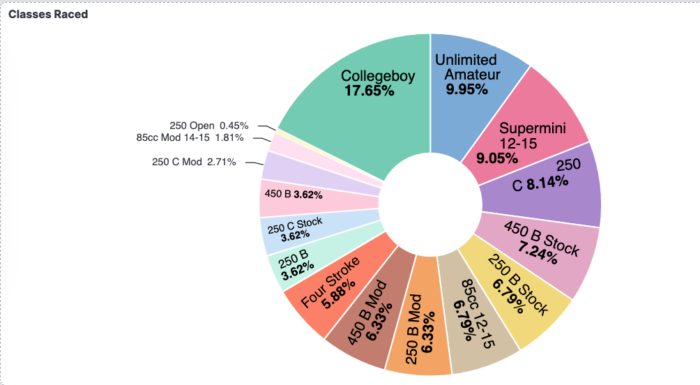
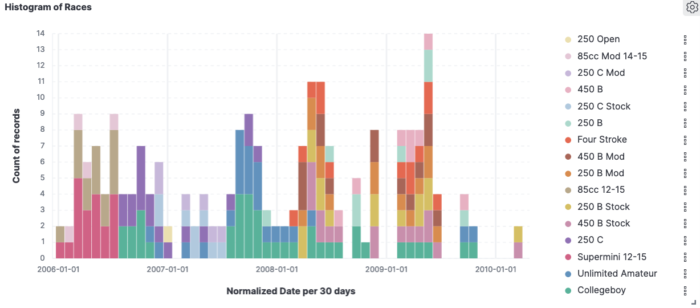
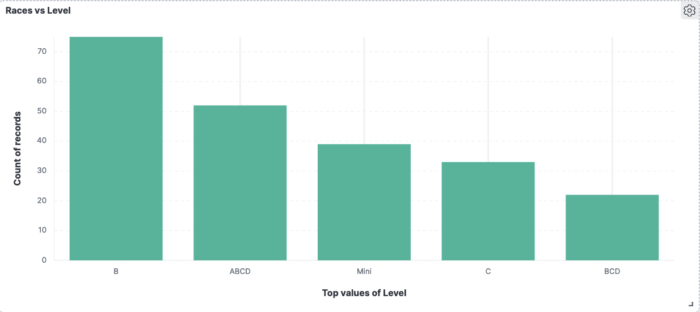
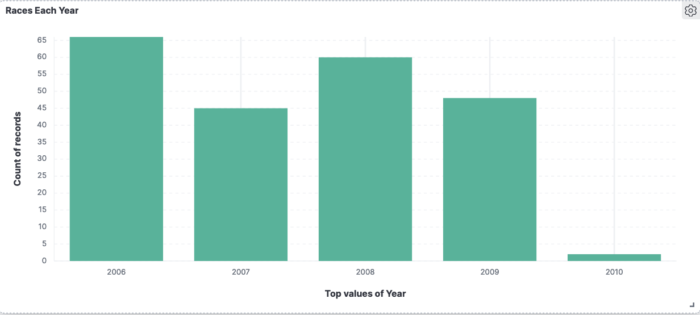
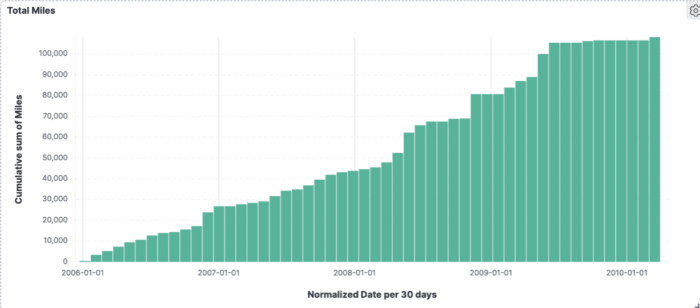
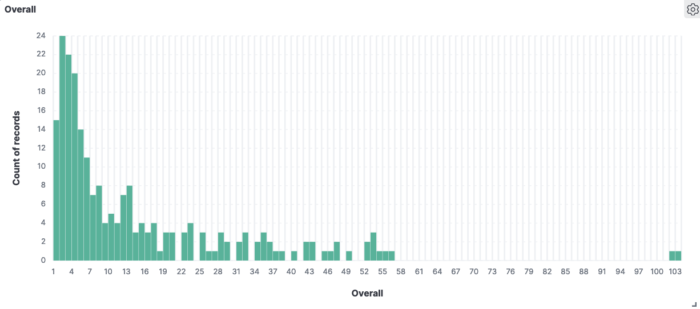
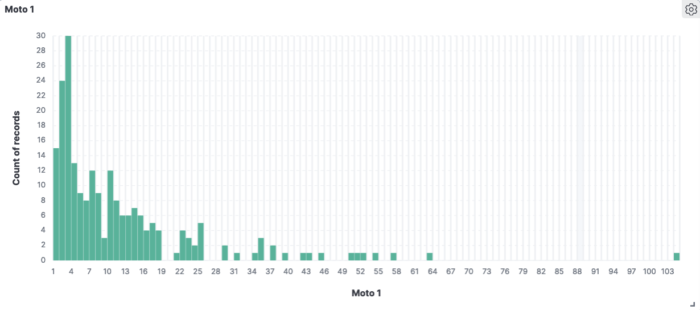
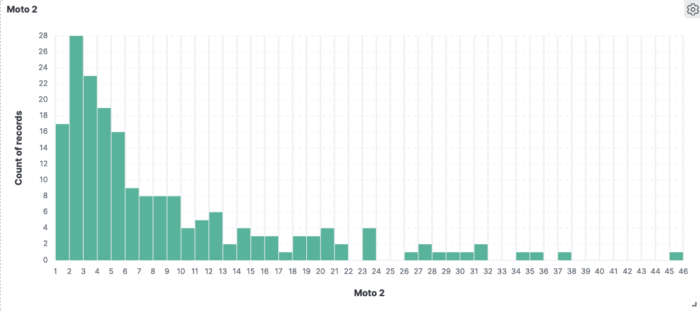
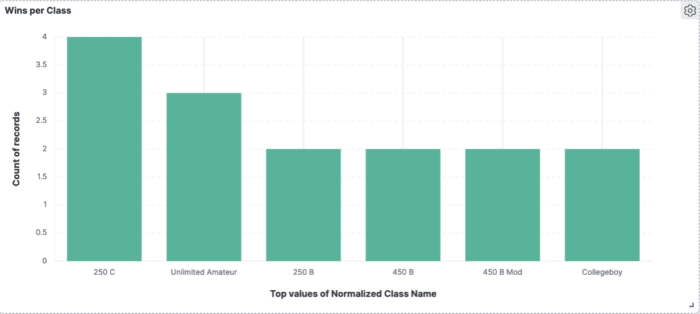
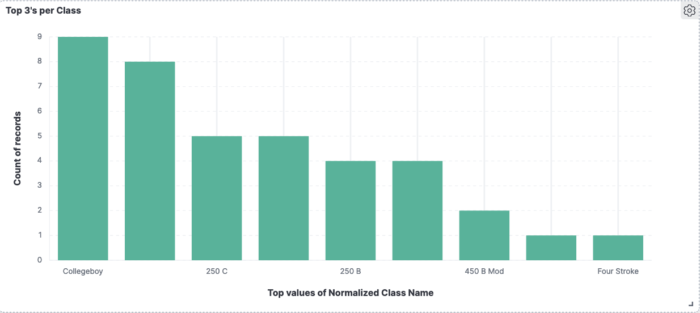
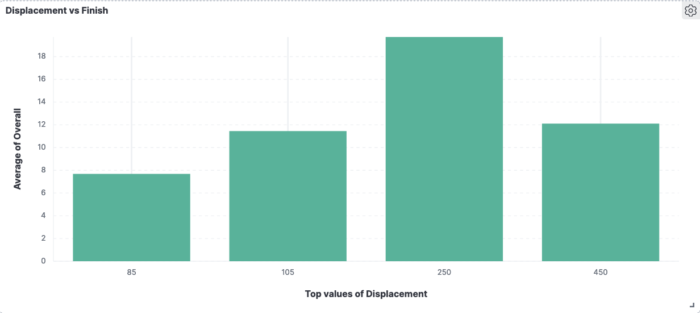
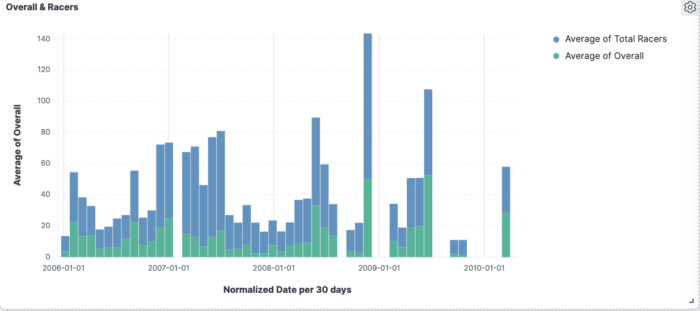
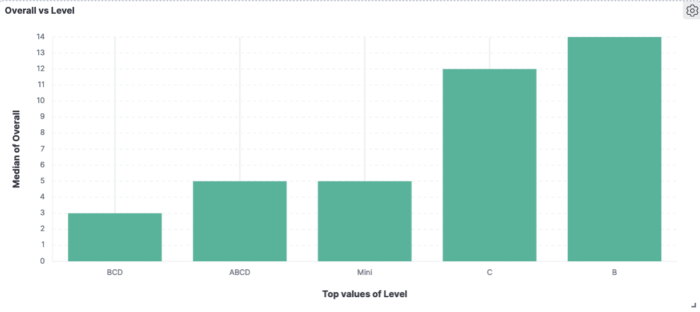
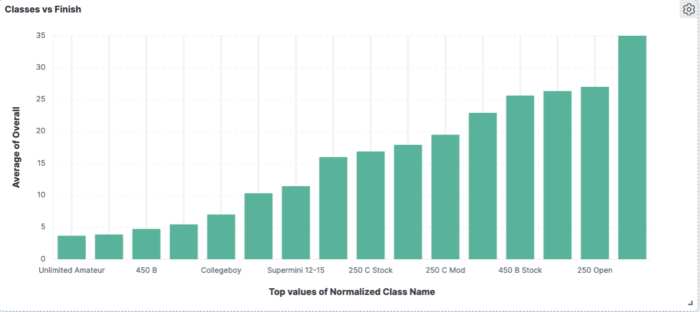
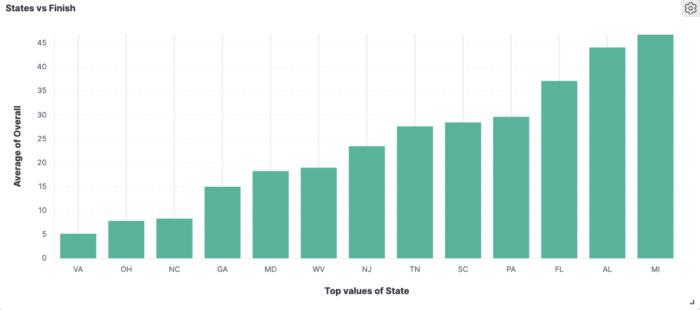
Now on to the fun part! What does this data look like once I start breaking it down… it begins to look something like this:
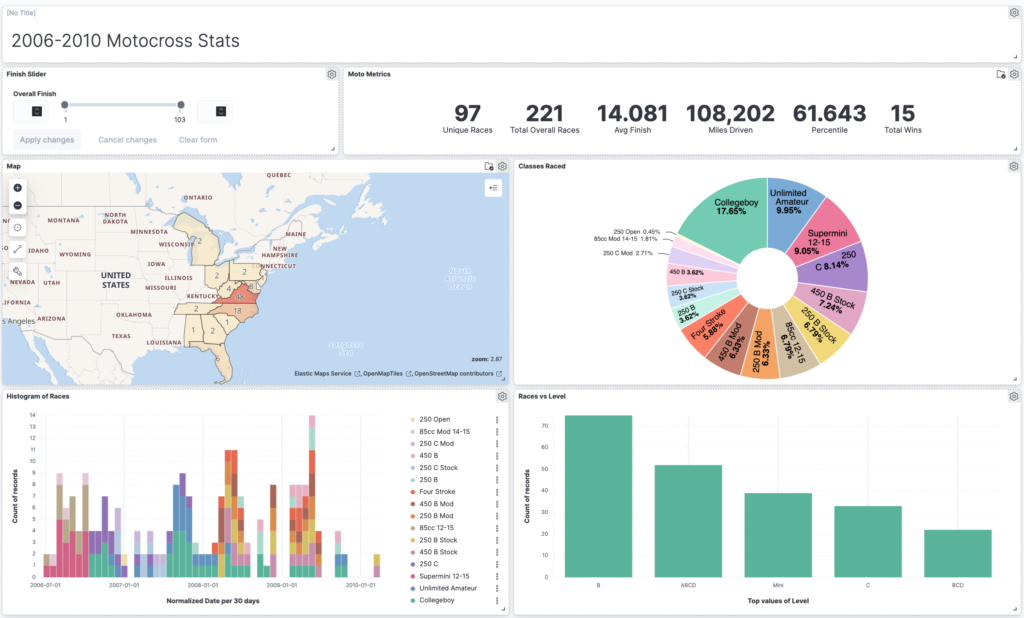
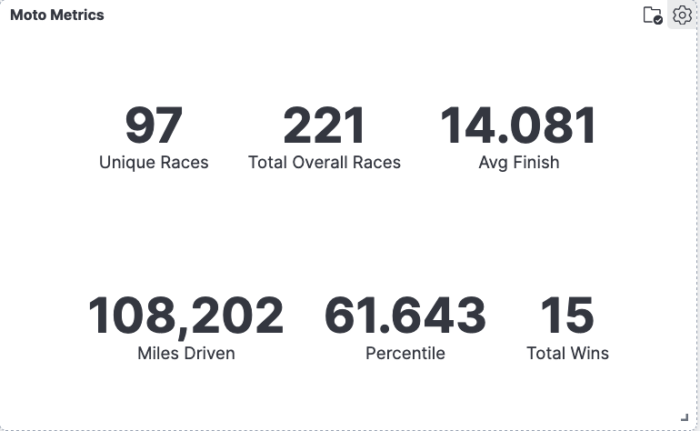
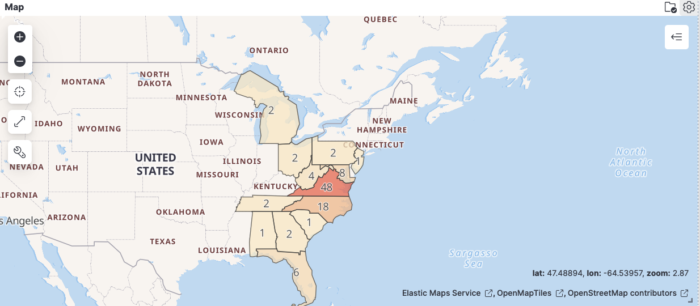
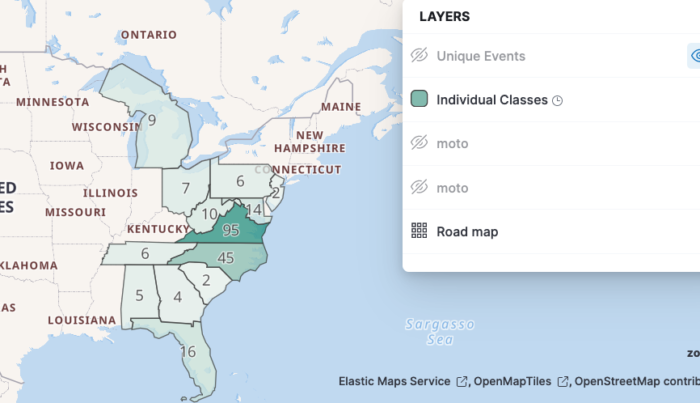
This dashboard is quite large, so instead of screen pic of the entire thing, I’ll take some individual pictures and provide some captions as to what you’re seeing on each.
Whew! That’s a lot to cover. Did I mention all of these graphs are interactive? You can filter, apply timelines, sort, and customize your data toggles and all of the dashboards update automatically. I have spent hours sifting and sorting through this data, but here’s a gif that should give you an idea of what you can do.
Below, I filter out VA based races and am scrolling through all stats from outside VA.
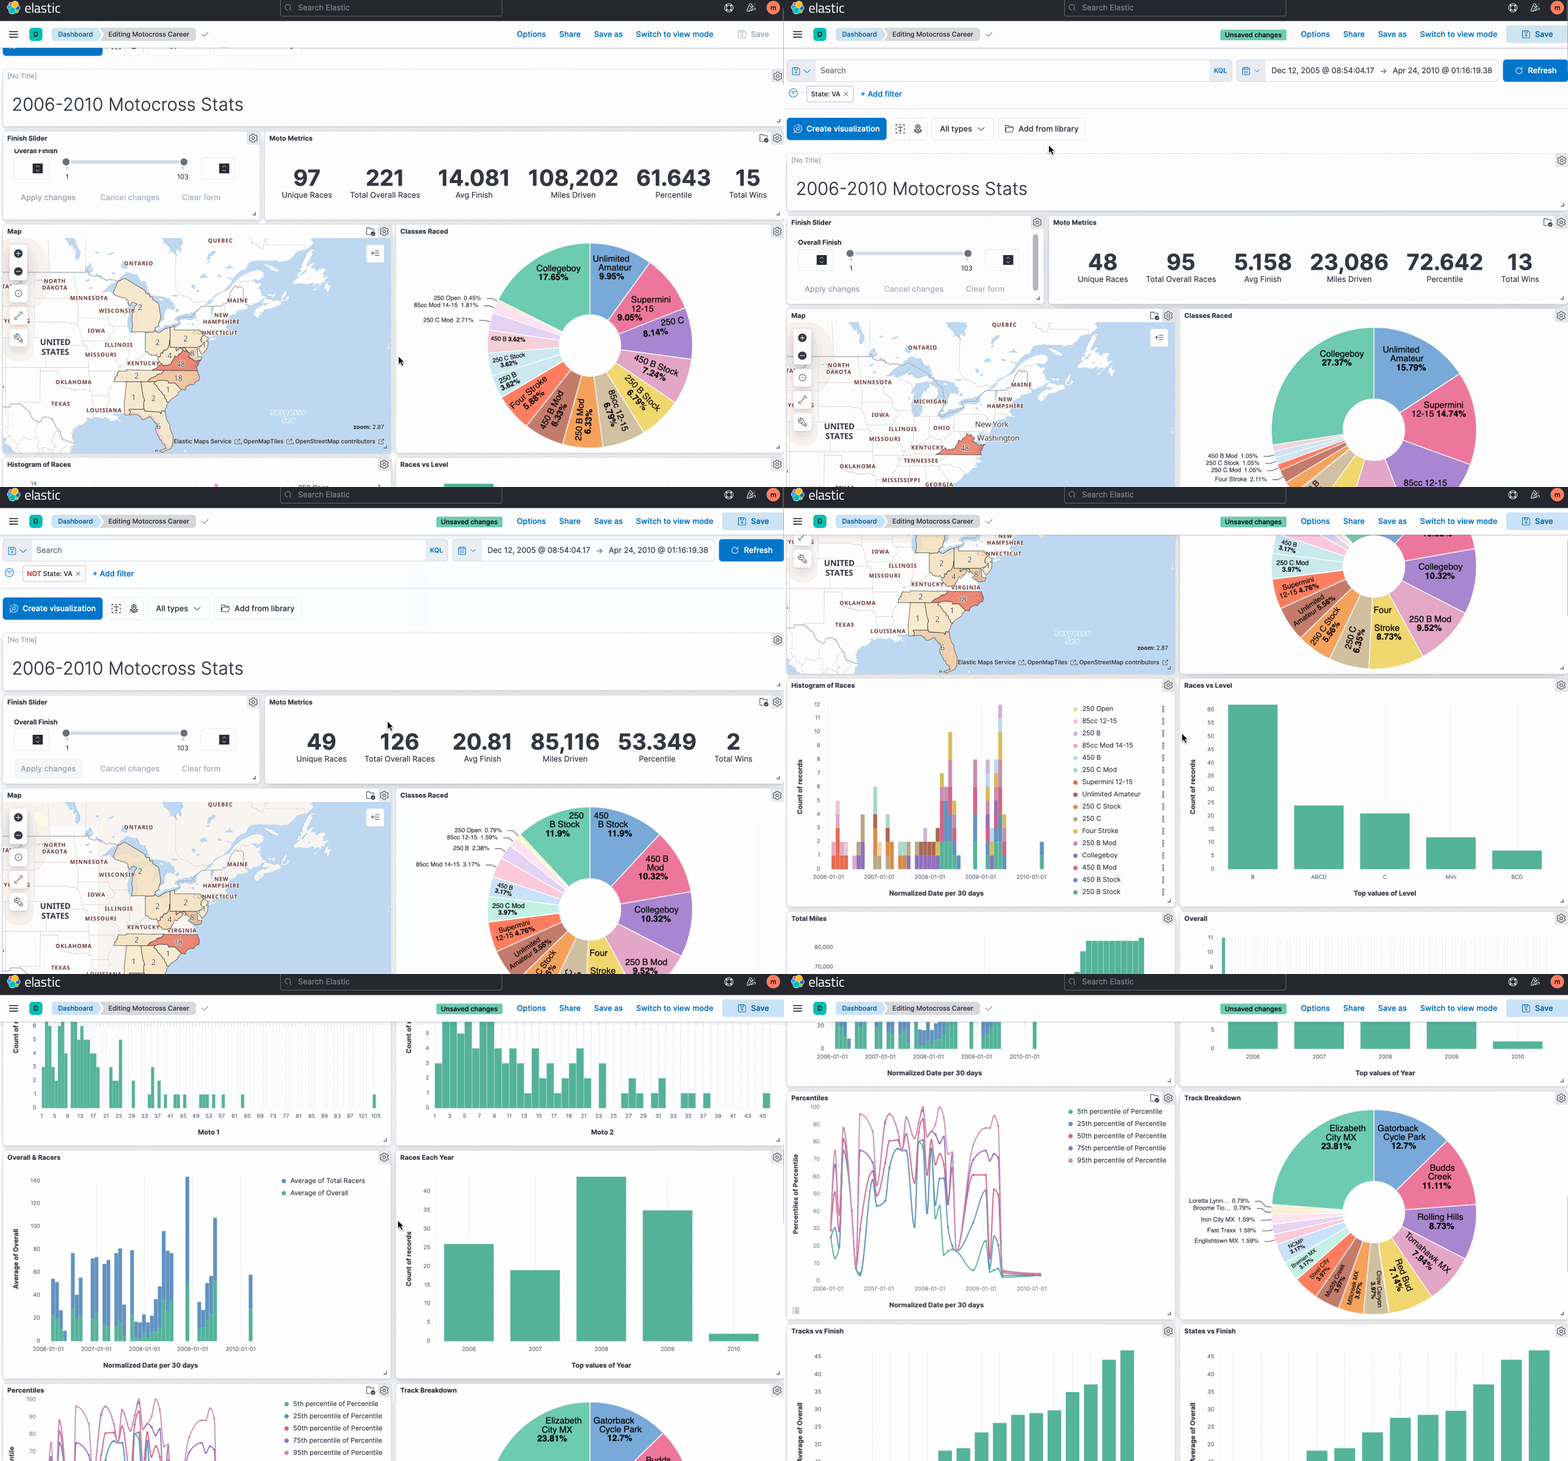
You can do this with my overall placements, filter by year I was racing, particular tracks, or any other dimension I have available. Questions like:
- What year did I get the most overall wins?
- What was the best track I raced at?
- What was the biggest race I ever won (in terms of number of entries)?
- Did I do better in C class, B class, or on my mini bike?
- If you exclude races I did not qualify or DNS/DNF, how does that change the stats?
As a wrap up note, this data is not perfect. It has some of my classes or results wrong (impossible overalls based on the number of riders), is missing motos or big wins (looking at you Gatorback 2007), and was hand entered by me very late at night… there’s probably mistakes.
Overall, this has been a really cool project and I feel like I get to apply the skills I learn in my career backwards in time to a sport I have loved for even longer. Thanks for reading!


